Estimating Affordable Housing Demand
Overview
To estimate the demand for affordable housing, we used a combination of HUD estimates of the number of households (by tenure, income, and size of household) and Census data on household types (by the size of household).
The U.S. Census Bureau creates custom tabulations of American Community Survey data for HUD divisions, including CHAS (Comprehensive Housing Affordability Strategy) data and “Special Tabulations” data used by HUD’s Economic and Market Analysis Division (EMAD). The CHAS data is used to estimate the number of households in need of housing assistance, based on incomes at qualifying levels for various HUD programs (primarily 30, 50, and 80% of AMI), as well as the prevalence of certain housing problems. We estimated the number of households at each income level using CHAS data.
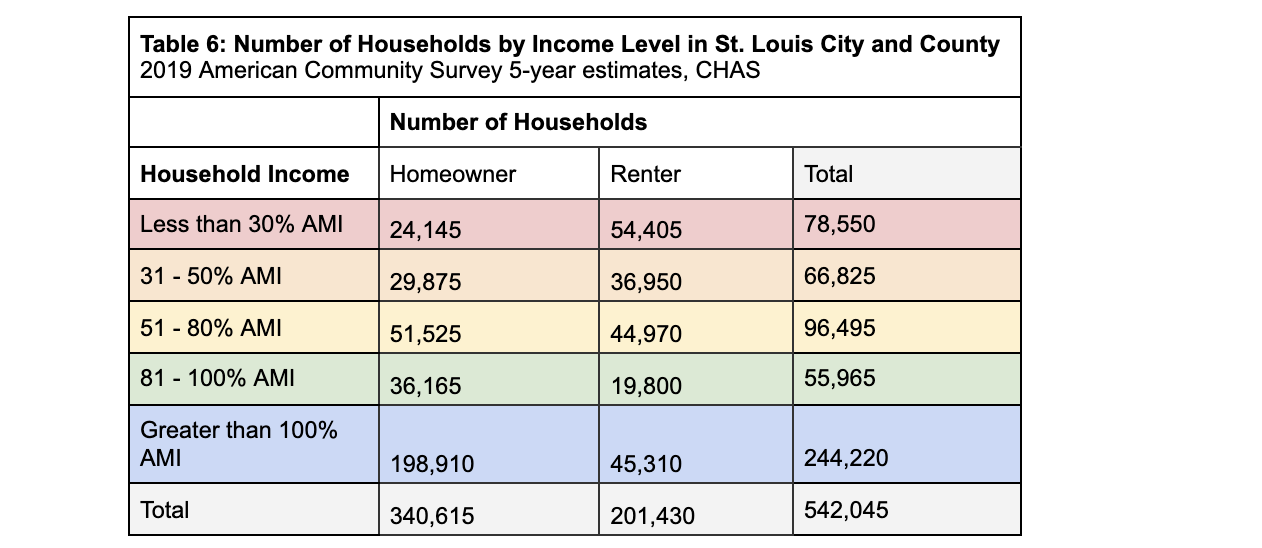
Securing affordable housing is more of a challenge for renters. More than one in four renter households (27%) are in the lowest income bracket, compared to 7% of homeowners. In fact, only 22% of renters in St. Louis City and County make more in household income than the region’s median family income.
The EMAD data allows us to produce counts of households by tenure, income intervals, and by size of household. We estimated the number of bedrooms that each size of household would need based on the distribution of household types within that household size. The distribution of household types within that household size was calculated using 2010 Census data.

Renters
The largest group of renter households are 1-person households that make less than $20,000 per year in annual income, followed by 1-person households that make between $20,000 and $34,999.
The size of household most likely to be making $60,000 to $99,999 and more than $100,000 are 2-person households.
4-person households are evenly distributed across income groups.
Homeowners

The largest group of homeowner households are 2-person households that make more than $100,000 per year in household income, followed by 4-person households that make more than $100,000 per year.
However, 1-person homeowner households are most likely to have an income between $20,000 and $34,999, followed by households with incomes less than $20,000.
Given the prevalence of wealthier homeowner households in the St. Louis market, there are minimal market forces for home builders to construct or rehab smaller, less expensive homes for purchase.
According to national American Community Survey 2019 estimates, less than 15% of two-person nonfamilies are unmarried opposite-sex or same-sex couples who would likely share a bedroom. The model may be amended in the future when better city-level data is available about the prevalence of unmarried couples under the nonfamily designation.
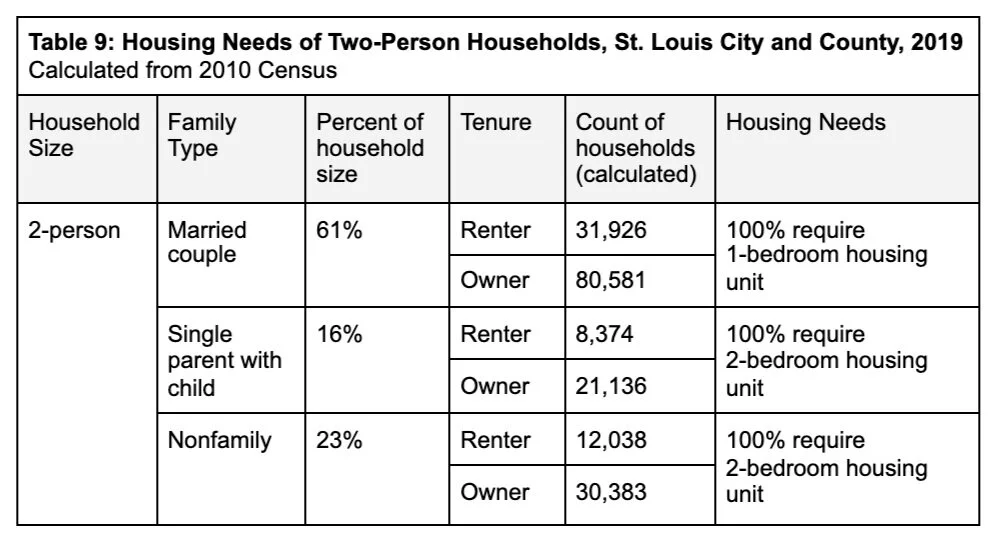
Let’s go through an example. A household of two people can be three separate household types: a married couple, a single parent with a child, or two roommates who are not related (nonfamily). Based on 2010 Census data, we found 61% of two-person households were married-couple families, and in our model we assume that 100% of these married couples require 1-bedroom units. 16% of two-person households are single parent families, and in our model we assume 100% of single parent families with one child require 2-bedrooms. 23% of two-person households are nonfamilies, and in our model we assume 100% of non families require 2-bedrooms. According to 2019 occupancy data from the American Community Survey, there are an estimated 52,338 two-person rental households and 132,100 two-person homeowner households in St. Louis City and County.
Lastly, we assume that the distribution of the bedroom needs of similarly sized household types are the same, regardless of income or tenure. For 2-person renter- or owner-occupied households, we assume that 61% of these households will require 1-bedroom units and the remaining 39% will require 2-bedroom units at each income level and tenure status.
We repeated this exercise for 1-person, 3-person, or more than 4-person households. We assume that 50% of families who have multiple children will have them share a bedroom. For 1-person households, we assume that 4% will need studios, while 96% will need 1-bedrooms. For 3-person households, we assume that 65% will need 2-bedrooms, while 35% will need 3-bedrooms. For 4-person households, we assume that 43% need 2-bedrooms, 44% need 3-bedrooms, and 13% need 4-bedrooms. Lastly, we duplicated this analysis for owner-occupied households with the assumption that 20% of families who have multiple children will have them share a bedroom.

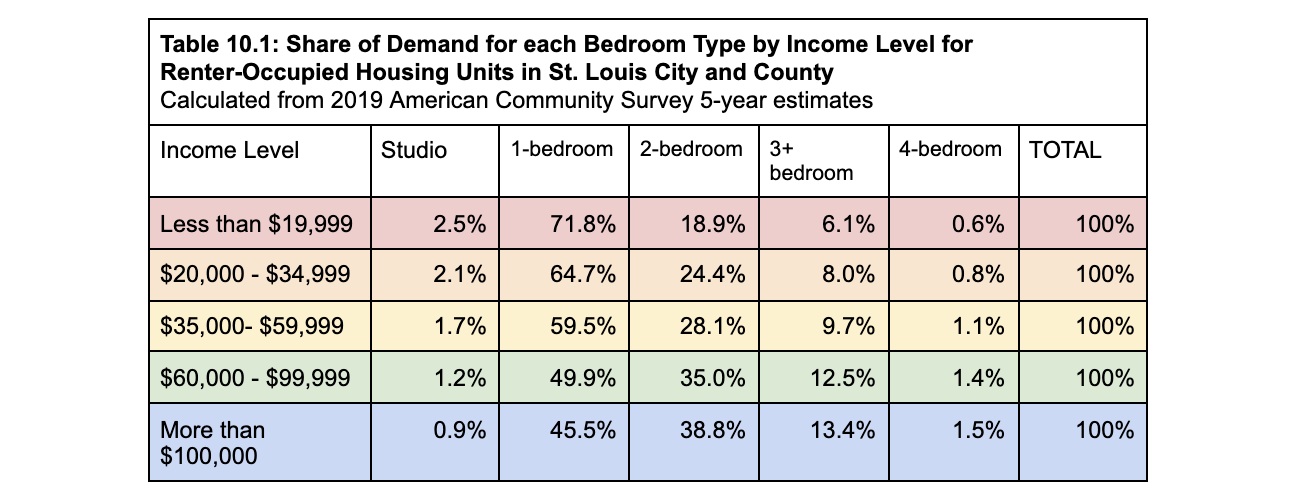
These counts are then converted into the percentage share of each bedroom type that households in every income bracket need. This allows for standardization across data sets for use in the final model.